Wishlist 0 ¥0.00

MySQL: What read_buffer_size Value is Optimal?

The more I work with MySQL Performance Optimization and Optimization for other applications the better I understand I have to less believe in common sense or common sense of documentation writers and do more benchmarks and performance research. I just recently wrote about rather surprising results with sort performance and today I’ve discovered even read_buffer_size selection may be less than obvious.

MySQL read_buffer_size

What do we generally hear about read_buffer_size tuning? If you want fast full table scans for a large table you should set this variable to some high value. Sample my.cnf values on large memory sizes recommend 1M settings and MySQL built-in default is 128K. Some people having a lot of memory and few concurrent connections set it as high as 32M in hopes for better performance. Let’s see if it is really best strategy:

To check things out I’ve created a table with a simple structure:

Populated it with 75M of rows to reach 4G in size so the workload will be IO bound on the box with 2GB of memory.
The was running Fedora Core i686 had 2 Xeon CPUs and 2 drives in RAID0.

I’ve used the following query to perform full table scans, with 3 runs and averaged results. MySQL 5.1.21-beta was used for tests.

Here are the results I’ve got:

read_buffer_size impace on scan performance
read_buffer_size Time (sec)
8200 45.2
16K 44.8
32K 45.6
64K 43.4
128K 43.0
256K 51.9
512K 60.8
2M 65.2
8M 66.8
32M 67.2

8200 bytes is the minimum size for read_buffer_size, this is why we start from this value.

As you can see results look really strange. Performance indeed grows by a few percent as you increase the buffer to 128K but after that instead of improving any further, it drops down sharply being 50% slower at the 2MB size. After this value, it continues to drop slowly all the way to 32M.

Why this is happening? I have not spent enough time to come up with a good explanation. It could be OS has to split large requests into multiple ones submitting them to the device which slows things down or it could be something else. But the fact remains – on some platforms for some workloads large read_buffer_sizes may hurt you even on large full table scans. (I wrote about some other cases when it hurts a while ago)

Let us do one more test – what if we test out smaller table (which fits in OS cache):

read_buffer_size impace on in memory table
read_buffer_size Time (sec)
8200 4.15
16K 4.15
32K 4.12
64K 4.11
128K 4.11
256K 4.12
512K 4.25
2M 4.49
8M 4.54
32M 4.58

As you see the difference in percents is smaller with only 10% difference between best and worst numbers but the best number still remains the same – 128K and 32M is again the worst value. This means it can’t request split issues, at least not just that.

Note: In this case, I’m really curious how much values change on different platforms (OS and Hardware) as well as different file systems as these could all be involved here. Different table structures (ie longer rows) also may affect results, not to mention tables with fragmented rows when IO pattern can be a lot different.

The degree of parallelism is another important variable which was not considered – small buffers with high concurrency may mean more seeks and so worse performance, or maybe not – something to test as well.

In general, it just reconfirms one basic thing – do not just grab someone else’s “best configuration” from the web and apply for your application if you’re interested in best performance – experiment with realistic load and realistic data (including fragmentation) to find what works best for you.

windows下如何快速查看端口是否开放

有时候我们需要在windows下确定一下某个端口是否开放,有什么最简单的方法呢?本文介绍两种方法,有最直接的方法,也有最简单的方法。


1、查看一个端口是否开放的最简单方法

查看端口是否开放,需要在dos里使用命令来完成。这个命令就是:

  • netstat -ano

这个命令能显示当前电脑有哪些端口正在使用,如下图:

查看端口是否开放

查看哪些端口在使用

上图显示,一些常见的端口正在被使用,如:80、443、8000、8888等。

我们可以这样来查看一个端口有无开启。如果你在上图列表里没有看到某端口,则说明没有开启此端口。如上图列表里没有出现3389的端口,说明没有开启3389的端口。

这个命令使用简单,是查看一个端口有无开启的最简单方法。

2、查看一个端口是否开放的最直接方法

如果你认为要在一个列表里用肉眼检查某端口有无使用比较不实用,因为有可能会看漏眼。有无方法可以直接检查某端口有无开启呢?答案是“有”,可以用此命令来查看:

  • netstat -ano -p tcp | find "3389" >nul 2>nul && echo 3389端口已开启 || echo 3389未开启

此命令是检查3389端口有无开启,如果有就输出“3389端口已开启”,否则显示“3389未开启”,如图:

查看端口是否开放

直接检查某端口有无开启

以上便是检查一个端口有无开启的最简单的方法,以及最直接的方法。

知识扩展:参数 -ano 是什么意思?

其实在平时使用中,都是用最简单的方法比较多,只要记住“netstat”这个命令即可,使用如下命令可以获得参数:

  • netstat /?

查看端口是否开放

netstat使用帮助

参数“-ano”的意思是:

-a 显示所有连接和侦听端口
-n 以数字形式显示地址和端口号
-o 显示拥有的与每个连接关联的进程ID

各个参数可以连在一起配合使用。

Lots of “Query End” states in MySQL, all connections used in a matter of minutes

3
 

This morning I noticed that our MySQL server load was going sky high. Max should be 8 but it hit over 100 at one point. When I checked the process list I found loads of update queries (simple ones, incrementing a "hitcounter") that were in query end state. We couldn't kill them (well, we could, but they remained in the killed state indefinitely) and our site ground to a halt.

We had loads of problems restarting the service and had to forcibly kill some processes. When we did we were able to get MySQLd to come back up but the processes started to build up again immediately. As far as we're aware, no configuration had been changed at this point.

So, we changed innodb_flush_log_at_trx_commit from 2 to 1 (note that we need ACID compliance) in the hope that this would resolve the problem, and set the connections in PHP/PDO to be persistent. This seemed to work for an hour or so, and then the connections started to run out again.

Fortunately, I set a slave server up a couple of months ago and was able to promote it and it's taking up the slack for now, but I need to understand why this has happened and how to stop it, since the slave server is significantly underpowered compared to the master, so I need to switch back soon.

Has anyone any ideas? Could it be that something needs clearing out? I don't know what, maybe the binary logs or something? Any ideas at all? It's extremely important that we can get this server back as the master ASAP but frankly I have no idea where to look and everything I have tried so far has only resulted in a temporary fix.

Help! :)

share improve this question

3 Answers


29


I'll answer my own question here. I checked the partition sizes with a simple df command and there I could see that /var was 100% full. I found an archive that someone had left that was 10GB in size. Deleted that, started MySQL, ran a PURGE LOGS BEFORE '2012-10-01 00:00:00' query to clear out a load of space and reduced the /var/lib/mysql directory size from 346GB to 169GB. Changed back to master and everything is running great again.

From this I've learnt that our log files get VERY large, VERY quickly. So I'll be establishing a maintenance routine to not only keep the log files down, but also to alert me when we're nearing a full partition.

I hope that's some use to someone in the future who stumbles across this with the same problem. Check your drive space! :)

  • 1
    Thanks, this was the fix for our issue. For others finding this answer if you are running a Galera mysql cluster, check all the servers for disk space as they will all get stuck on ‘query end’ even if it is just one of the nodes full. – chris Oct 1 '14 at 8:42

 
7
 

We've been having a very similar problem, where the mysql processlist showed that almost all of our connections were stuck in the "query end" state. Our problem was also related to replication and writing the binlog.

We changed the sync_binlog variable from 1 to 0, which means that instead of flushing binlog changes to disk on each commit, it allows the operating system to decide when to fsync() to the binlog. That entirely resolved the "query end" problem for us.

According to this post from Mats Kindahl, writing to the binlog won't be as much of a problem in the 5.6 release of MySQL.

  •  
    sync_binlog=0 has the potential problem in a crash: a Slave may say "binlog at an impossible position". – Rick James Dec 6 '18 at 17:46

 
3
 

In my case, it was indicative of maxing out the I/O on disk. I had already reduced fsyncs to a minimum, so it wasn't that. Another symptoms is "log*.tokulog*" files start accumulating because the system can't catch up all the writes.

MySQL 重要参数 innodb_flush_log_at_trx_commit 和 sync_binlog

innodb_flush_log_at_trx_commit

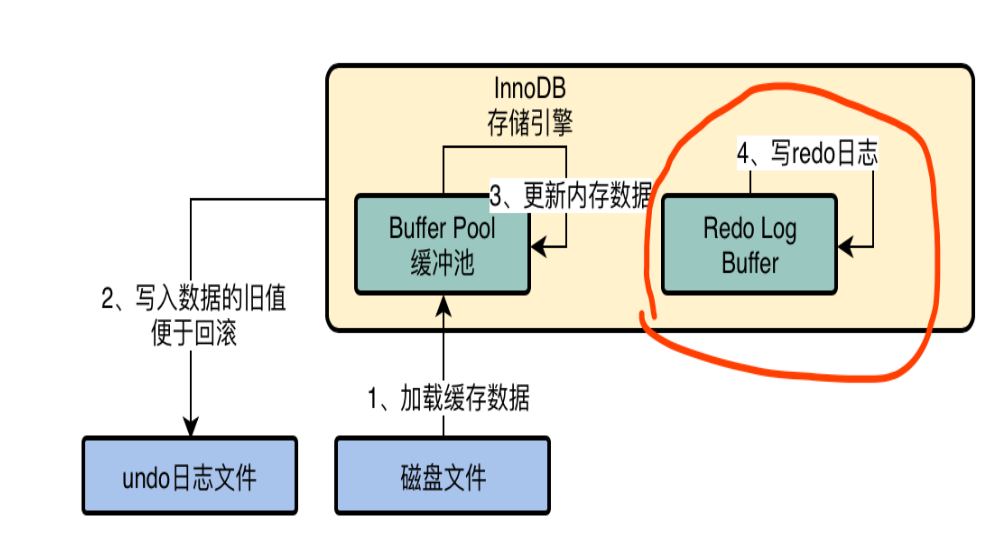
提交事务的时候将 redo 日志写入磁盘中,所谓的 redo 日志,就是记录下来你对数据做了什么修改,比如对 “id=10 这行记录修改了 name 字段的值为 xxx”,这就是一个日志。如果我们想要提交一个事务了,此时就会根据一定的策略把 redo 日志从 redo log buffer 里刷入到磁盘文件里去。此时这个策略是通过 innodb_flush_log_at_trx_commit 来配置的,他有几个选项。
值为0 : 提交事务的时候,不立即把 redo log buffer 里的数据刷入磁盘文件的,而是依靠 InnoDB 的主线程每秒执行一次刷新到磁盘。此时可能你提交事务了,结果 mysql 宕机了,然后此时内存里的数据全部丢失。
值为1 : 提交事务的时候,就必须把 redo log 从内存刷入到磁盘文件里去,只要事务提交成功,那么 redo log 就必然在磁盘里了。注意,因为操作系统的“延迟写”特性,此时的刷入只是写到了操作系统的缓冲区中,因此执行同步操作才能保证一定持久化到了硬盘中。
值为2 : 提交事务的时候,把 redo 日志写入磁盘文件对应的 os cache 缓存里去,而不是直接进入磁盘文件,可能 1 秒后才会把 os cache 里的数据写入到磁盘文件里去。
可以看到,只有1才能真正地保证事务的持久性,但是由于刷新操作 fsync() 是阻塞的,直到完成后才返回,我们知道写磁盘的速度是很慢的,因此 MySQL 的性能会明显地下降。如果不在乎事务丢失,0和2能获得更高的性能。

# 查询
select @@innodb_flush_log_at_trx_commit;

sync_binlog

该参数控制着二进制日志写入磁盘的过程。

该参数的有效值为0 、1、N:

0:默认值。事务提交后,将二进制日志从缓冲写入磁盘,但是不进行刷新操作(fsync()),此时只是写入了操作系统缓冲,若操作系统宕机则会丢失部分二进制日志。

1:事务提交后,将二进制文件写入磁盘并立即执行刷新操作,相当于是同步写入磁盘,不经过操作系统的缓存。

N:每写N次操作系统缓冲就执行一次刷新操作。

将这个参数设为1以上的数值会提高数据库的性能,但同时会伴随数据丢失的风险。
二进制日志文件涉及到数据的恢复,以及想在主从之间获得最大的一致性,那么应该将该参数设置为1,但同时也会造成一定的性能损耗。

About Us

Since 1996, our company has been focusing on domain name registration, web hosting, server hosting, website construction, e-commerce and other Internet services, and constantly practicing the concept of "providing enterprise-level solutions and providing personalized service support". As a Dell Authorized Solution Provider, we also provide hardware product solutions associated with the company's services.
 

Contact Us

Address: No. 2, Jingwu Road, Zhengzhou City, Henan Province

Phone: 0086-371-63520088 

QQ:76257322

Website: 800188.com

E-mail: This email address is being protected from spambots. You need JavaScript enabled to view it.